IIR Custom Filter Component
Q-SYS provides the capability of loading your filter design results into the IIR (Infinite Impulse Response) Custom Filter, giving you explicit control over the phase and magnitude response of the Custom IIR filter.
You set the size of the IIR filter, in the component properties, by specifying the number of biquad sections. If the IIR Filter component has more sections defined than what is contained in the loaded file, Q-SYS assigns unity response to unused sections. If there are more coefficients in the file than defined in the design, Q-SYS discards the extra coefficients.
Note: A change of the section count property is not immediately reflected in the component’s open control panel. Before loading a new coefficient set file, close the control panel and re-open it for the section count change to go into effect.
Typically, an IIR filter is designed using filter design software that computes the biquad numerator coefficients b0, b1 and b2 as well as the denominator coefficients a0, a1 and a2.
After you design the filter, you must export the coefficients to a .csv (comma separated value) file. This file is then loaded into the Q-SYS IIR Custom Filter at runtime. The .csv file containing the coefficients consists of rows of values, separated by commas, representing b0, b1, b2, a0, a1, a2 per row from left to right. Coefficient a0 must be non-zero. The trailing comma is optional.
0.004088876, 0.0081777519, 0.004088876, 1, -1.895419926, 0.9117754299,
0.004088876, 0.0081777519, 0.004088876, 1, -1.895419926, 0.9117754299,
0.004088876, 0.0081777519, 0.004088876, 1, -1.895419926, 0.9117754299,
Note: The number of signal pins is variable and set in the component's Type Property.
Input Pins
Input
Audio signal pins are represented by a  circle, and traditional wiring is represented by a thin black line.
By default, the IIR Custom Filter component is set to a Mono channel, which provides one input. Additionally, you can set the Properties to allow for Stereo, which gives you two inputs; or you can choose Multi-Channel, which will allow you to choose between 1 and 256 inputs.
Output Pins
Output
Audio signal pins are represented by a circle, and traditional wiring is represented by a thin black line.
By default, the IIR Custom Filter component is set to a Mono channel, which provides one output. Additionally, you can set the Properties to allow for Stereo, which gives you two outputs; or you can choose Multi-Channel, which will allow you to choose between 1 and 256 outputs.
Tip: For additional properties that are not listed, refer to the Properties Panel help topic for more information.
IIR Custom Filter Properties
Section Count
Determines the number of biquad sections for the filter. The quantity defined here should match the number of coefficient rows contained in the.csv file loaded at runtime. You can choose between 1 and 256.
Channels
Type
Sets the type of Channel input and output. By default, the IIR Custom Filter component is set to a Mono channel, which provides one output. Additionally, you can set the Properties to allow for Stereo, which gives you two outputs; or you can choose Multi-Channel, which will allow you to choose between 1 and 256 outputs.
Count
This only appears when Multi-channel Type is selected, you can select from 1 to 256 channels.
Response Panel
Enabled
If enabled, you will have access to the Response Graph in Controls.
Size
You can choose to view the Response Graph in Small, Medium, or Large scale within the Controls.
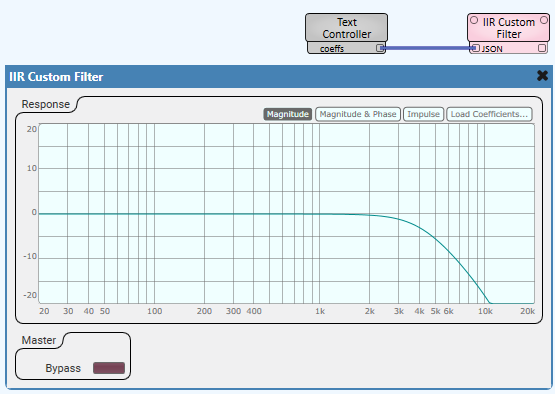
Response Graph
The scales for the Response Graph vary depending on the measurement method you select.
The vertical line of the crosshair cursor provides a readout of its position on the X axis scale.
The vertical movement of the horizontal crosshair follows the magnitude or amplitude of the signal.
Magnitude
Measures the magnitude of the input signal over the audio frequency range. Represented by the blue line.
Magnitude / Phase
Same as the Magnitude selection but with the addition of a phase line.
Impulse
Measures amplitude (Y axis) vs. time in milliseconds (X axis) of the impulse response. Range: X Axis = 0.0ms to 10.7 ms
Load Coefficients
Opens a standard Windows "Open" dialog box where you can navigate to, and open either a .csv or .wav file containing the coefficients defining the filter.
Note: A change of the section count property is not immediately reflected in the component’s open control panel. Before loading a new coefficient set file, close the control panel and re-open it for the section count change to go into effect.
Master
Bypass
Bypasses all phase and magnitude response of the Custom IIR filter.
|
Pin Name |
Value |
String |
Position |
Pins Available |
|---|---|---|---|---|
|
Master |
||||
|
Bypass |
0 1 |
no bypassed |
0 1 |
Input / Output |
|
JSON1 |
(text) |
Input / Output |
||
Expected JSON is a JSON array of floats for the filter values.
Schematic Example
Script Example
require("json")
coeffs_json = json.encode( { 0.0494899563, 0.0989799125, 0.0494899563, 1.0, -1.279632425, 0.4775922501 } )
print( coeffs_json )
Controls["coeffs"].String = coeffs_json
Debug Output
2023-09-01T14:23:48.524	Starting Script
2023-09-01T14:23:48.525	[0.0494899563,0.0989799125,0.0494899563,1.0,-1.279632425,0.4775922501]