EzSVG
Use the EzSVG library to create SVG images dynamically within your design – for example, to help users visualize component status and control level changes.
Note: This topic provides some examples of usage within Q-SYS. Additional documentation can be found on the EzSVG page on Github within its README markdown file.
Syntax
Q-SYS implements the EzSVG library in its entirety with one addition and exception:
Use toString() as a replacement for the standard writeTo() call to ensure that the encoded SVG document is returned as a string.
Examples
Use these examples as a starting point for implementing EzSVG in your design. All examples use a Text Controller component for scripting, and each SVG graphic (called a "document") is drawn to a toggle button control (called SwitchSVGs in the code examples).
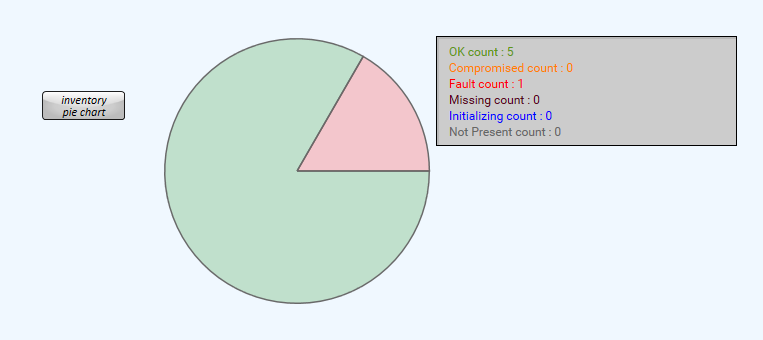
This example shows a pie chart of various device statuses. Text Controller is configured with six text box controls for each status type (OK, Compromised, etc.).
Lua Code
rapidjson = require("rapidjson")
EzSVG = require "EzSVG"
status =
{
[0.0] = { control = Controls.ok, color = "green", string = "OK" },
[1.0] = { control = Controls.compromised, color = "orange", string = "Compromised" },
[2.0] = { control = Controls.fault, color = "red", string = "Fault" },
[3.0] = { control = Controls.notpresent, color = "gray", string = "Not Present" },
[4.0] = { control = Controls.missing, color = "darkred", string = "Missing" },
[5.0] = { control = Controls.initializing, color = "blue", string = "Initializing" },
}
function getVec(angle, r, c)
return math.cos(math.rad(angle))*r +c.x, math.sin(math.rad(angle))*r + c.y
end
function drawSeg(doc, startAngle, perc, color)
if perc == 0 then return startAngle end
newAngle = startAngle + 360*perc
local path = EzSVG.Path({
stroke = "dimgray",
stroke_width = 0.5,
fill = color,
fill_opacity = "0.2"
})
c = { x = 50, y = 50 }
r = 45
path:moveToA(c.x, c.y)
x1, y1 = getVec(startAngle, r, c)
x2, y2 = getVec(newAngle, r, c)
path:lineToA(x1, y1)
largeFlag = 0
if perc > .50 then largeFlag = 1 end
--function(tbl, x, y, rx, ry, rotation, largeFlag, sweepFlag)
path:archToA( x2, y2, r, r, 0, largeFlag, 1)
path:lineToA(c.x,c.y)
doc:add(path)
return newAngle
end
function draw(values)
-- create a document
local doc = EzSVG.Document(100, 100)
EzSVG.setStyle({
stroke_width= 0.5,
stroke= "dimgray"
})
inv = Design.GetInventory()
-- set to 0
for k,v in pairs(status) do v.count = 0 end
-- count them up
for k,v in pairs(inv) do
status[v.Status.Code].count = status[v.Status.Code].count + 1
end
angle = 0
count = #inv
for k, v in pairs(status) do
if v.count == count then
doc:add(EzSVG.Circle(50, 50, 45):setStyle("fill", v.color):setStyle("fill_opacity", 0.2))
else
angle = drawSeg(doc, angle, v.count / count, v.color)
end
v.control.String = string.format("%s count : %i", v.string, v.count)
end
svg = doc:toString("Design\\doc-example.svg")
return doc:toString(svg)
end
t = Timer.New()
t.EventHandler = function()
Controls.SwitchSVGs.Legend = rapidjson.encode({
DrawChrome = false, -- Draw the button face and edges
IconData = Crypto.Base64Encode(draw()),
})
end
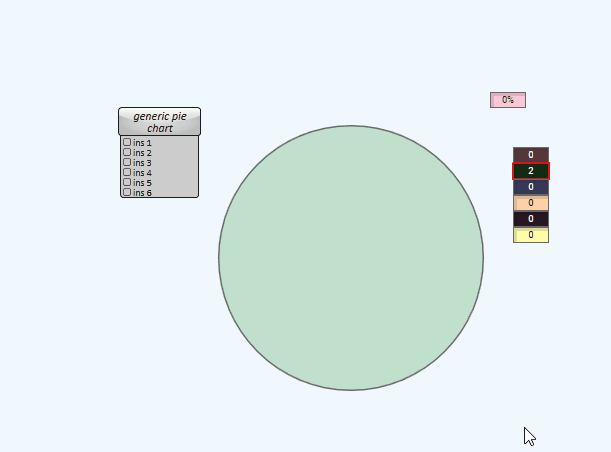
t:Start(1)Here's another example of a pie chart that dynamically updates based on each control's value.
Lua Code
rapidjson = require("rapidjson")
EzSVG = require "EzSVG"
colors = { "red", "green", "blue", "orange", "purple", "yellow" }
function getVec(angle, r, c)
return { x = math.cos(math.rad(angle))*r +c.x, y = math.sin(math.rad(angle))*r + c.y }
end
function drawSeg(doc, startAngle, perc, color, r, c, cr )
if perc == 0 then return startAngle end
newAngle = startAngle + 360*perc
local path = EzSVG.Path({
stroke = "dimgray",
stroke_width = 0.5,
fill = color,
fill_opacity = "0.2"
})
p1 = getVec(startAngle, r, c)
p2 = getVec(newAngle, r, c)
c1 = getVec(startAngle, cr, c)
c2 = getVec(newAngle, cr, c)
path:moveToA(c1.x, c1.y)
path:lineToA(p1.x, p1.y)
largeFlag = 0
if perc > .50 then largeFlag = 1 end
--function(tbl, x, y, rx, ry, rotation, largeFlag, sweepFlag)
path:archToA( p2.x, p2.y, r, r, 0, largeFlag, 1)
path:lineToA(c2.x,c2.y)
path:archToA(c1.x, c1.y, cr, cr, 0, largeFlag, 0)
doc:add(path)
return newAngle
end
function draw()
docSize = 1000
-- create a document
local doc = EzSVG.Document(docSize, docSize)
EzSVG.setStyle({
stroke_width= 0.5,
stroke= "dimgray"
})
count = 0
-- count them up
for k,v in ipairs(Controls.ins) do
count = count + v.Value
end
center = { x = docSize/2, y = docSize/2 }
radius = docSize*.45
centerRadius = Controls.r.Value * radius / 100
angle = 0
for k, v in pairs(Controls.ins) do
if v.Value == count then
doc:add(EzSVG.Circle(center.x, center.y, radius):setStyle("fill", colors[k]):setStyle("fill_opacity", 0.2))
else
angle = drawSeg(doc, angle, v.Value / count, colors[k], radius, center, centerRadius )
end
end
svg = doc:toString("Design\\doc-example.svg")
return doc:toString(svg)
end
function drawSVG(ctl)
Controls.SwitchSVGs.Legend = rapidjson.encode({
DrawChrome = false, -- Draw the button face and edges
IconData = Crypto.Base64Encode(draw()),
})
end
for k, v in pairs(Controls.ins) do
v.Color = colors[k]
v.EventHandler = drawSVG
end
Controls.r.EventHandler = drawSVG
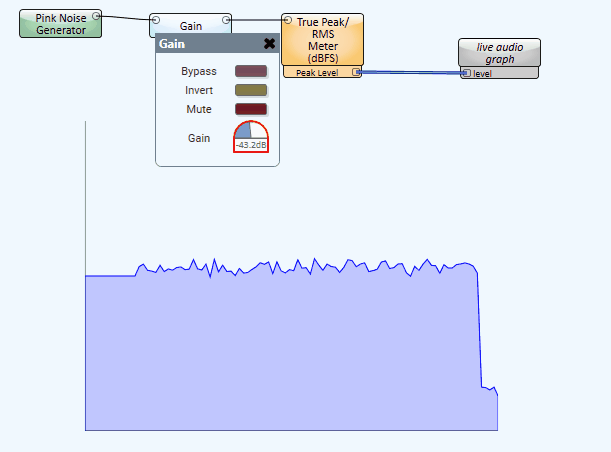
drawSVG()Here's an example of a live audio graph that changes as the Gain is adjusted.
Lua Code
rapidjson = require("rapidjson")
EzSVG = require "EzSVG"
function draw(values)
-- create a document
local doc = EzSVG.Document(800, 600)
EzSVG.setStyle({
stroke_width= 2,
stroke= "black"
})
doc:add(EzSVG.Line(0, 0, 0, 600))
doc:add(EzSVG.Line(0, 600, 800, 600))
-- create a path object and set its styling
local path = EzSVG.Path({
stroke = "blue",
stroke_width = 2,
fill = "blue",
fill_opacity = "0.2"
})
step = 800 / (#values-1)
path:moveToA( 0,600)
for k,v in ipairs(values) do
path:lineToA((k-1)*step,(1-v)*600)
end
path:lineToA(800,600)
-- add path to the doc
doc:add(path)
return doc:toString("Design\\doc-example.svg")
end
values = { }
for i = 1,100 do table.insert(values, 0.5) end
Controls.SwitchSVGs.Legend = rapidjson.encode({
DrawChrome = false, -- Draw the button face and edges
IconData = Crypto.Base64Encode(draw(values)),
})
t = Timer.New()
t.EventHandler = function()
table.insert(values, Controls.level.Position)
if #values > 100 then table.remove(values, #values -100) end
Controls.SwitchSVGs.Legend = rapidjson.encode({
DrawChrome = false, -- Draw the button face and edges
IconData = Crypto.Base64Encode(draw(values)),
})
end
t:Start(1)